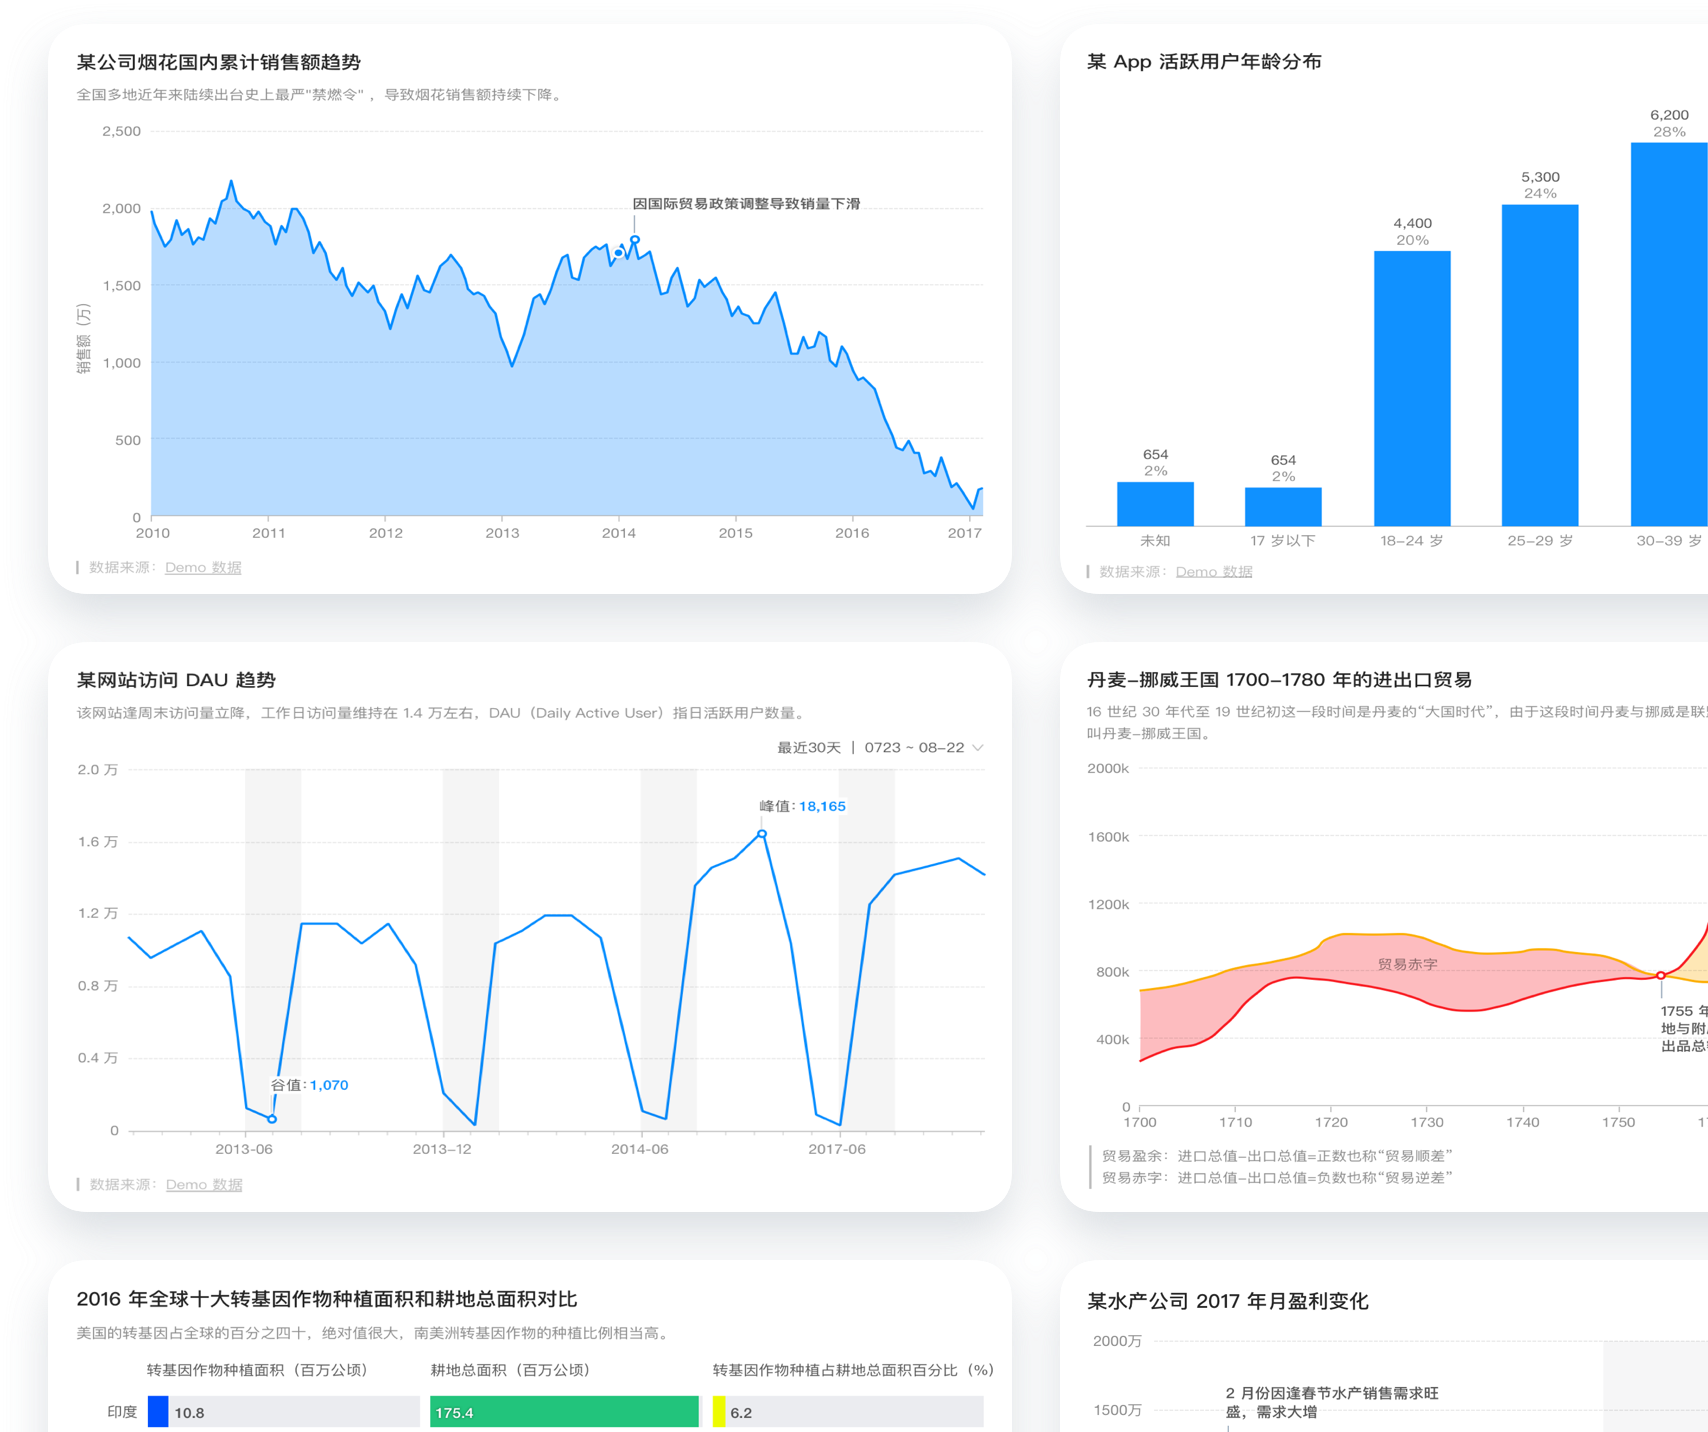
The AntV G2 data visualization Axure component library is based on the latest version 4.0 of AntV-G2, and the works are drawn using Axure controls, which can be modified and edited. Version 1.0 includes color palettes and functional components, totaling 16 categories and 52 charts: color palettes: brand color, classification color palette, monochrome sequential color palette, adjacent color sequential color palette, divergent color palette, overlay color palette, emphasis color palette, semantic color palette; Functional components: Cartesian coordinates, polar coordinates, reference lines, prompt information, charts.
G2 is a set of data-driven, highly interactive visual graphical syntax designed for regular statistical charts, with high usability and scalability. With G2, you can build various interactive statistical charts using Canvas or SVG with just one statement, without worrying about the tedious implementation details of charts.
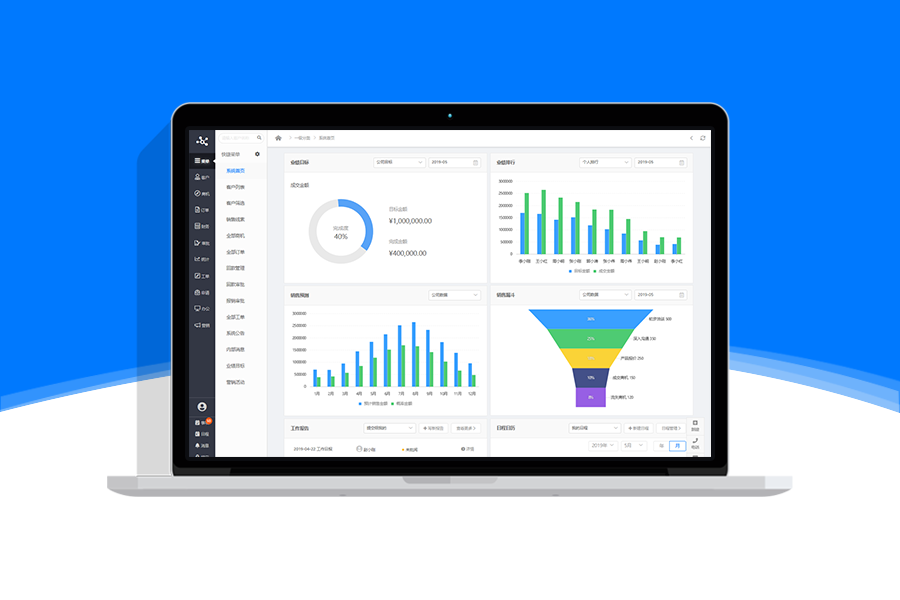
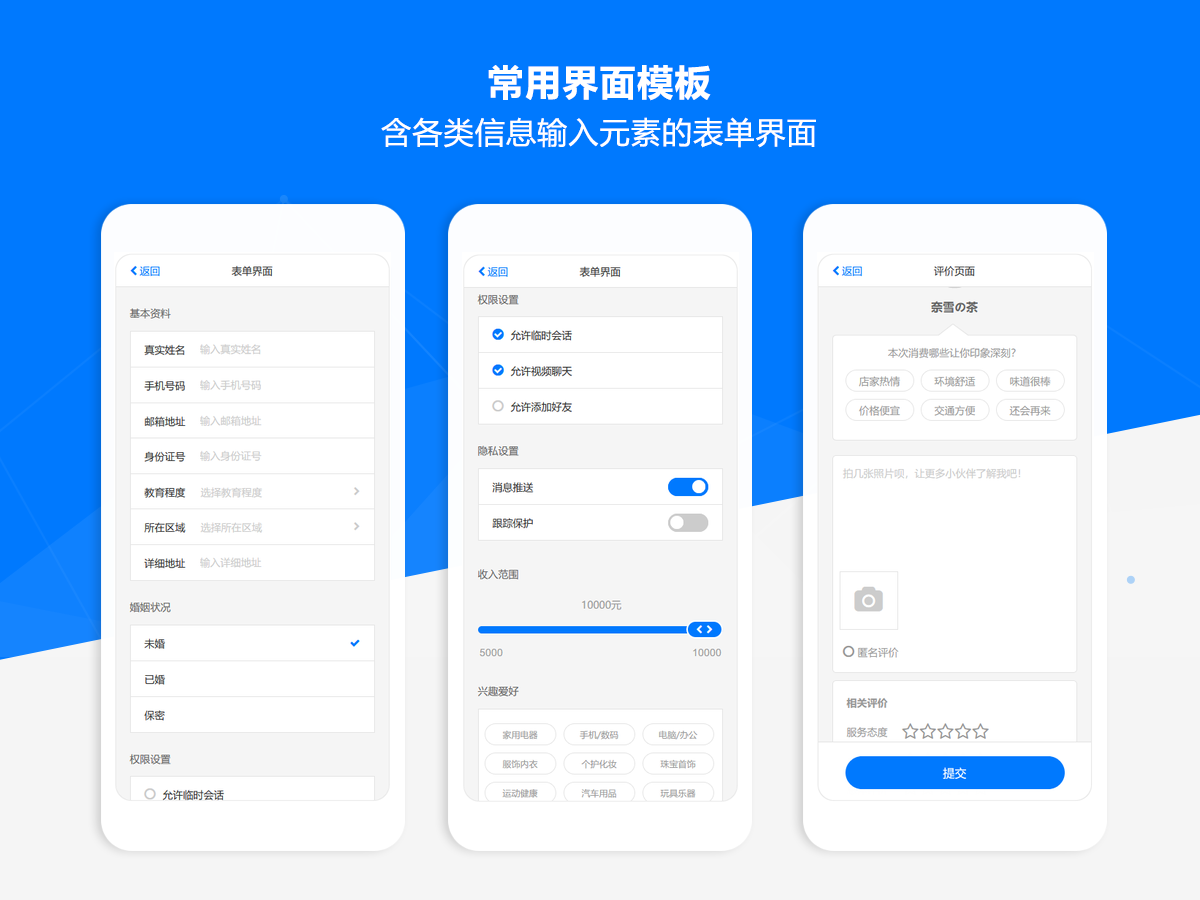
Screenshot
Copyright
Article Source: https://www.axuretheme.com/libraries/51.html

