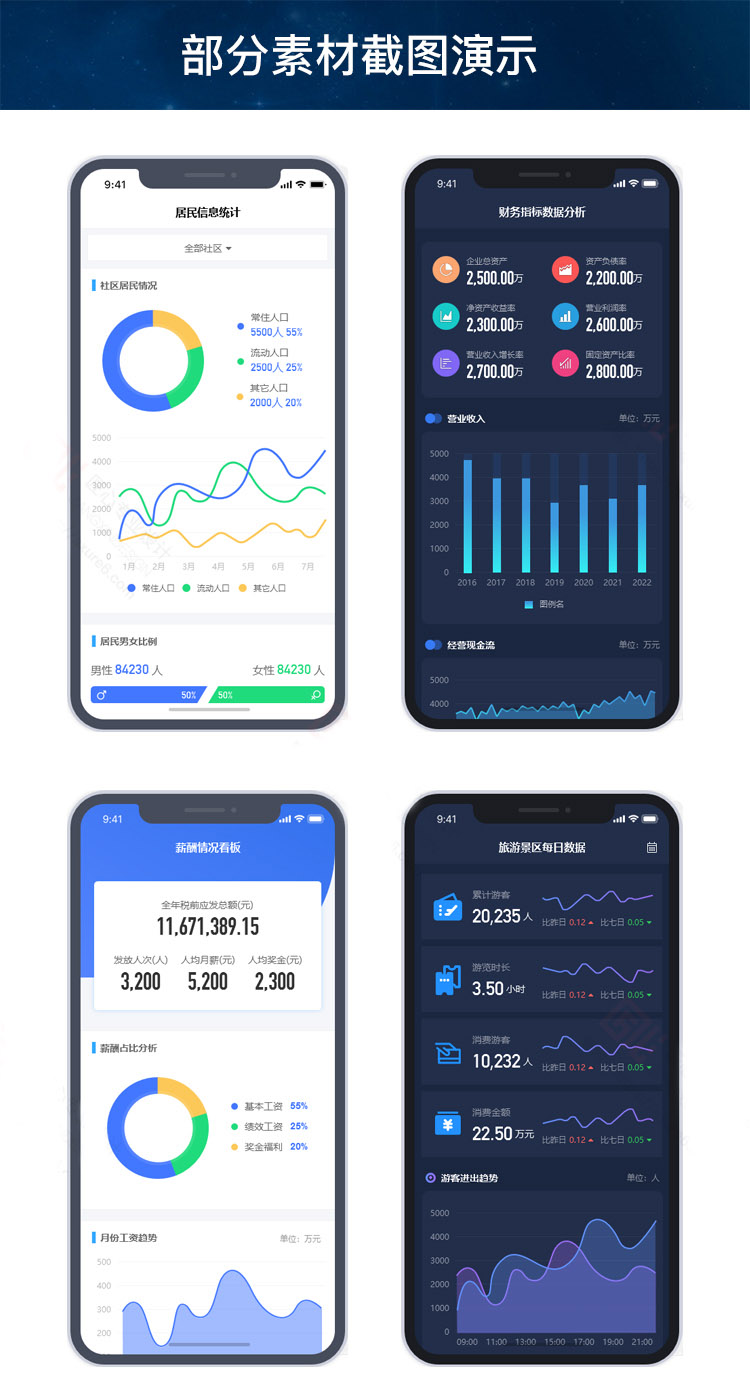
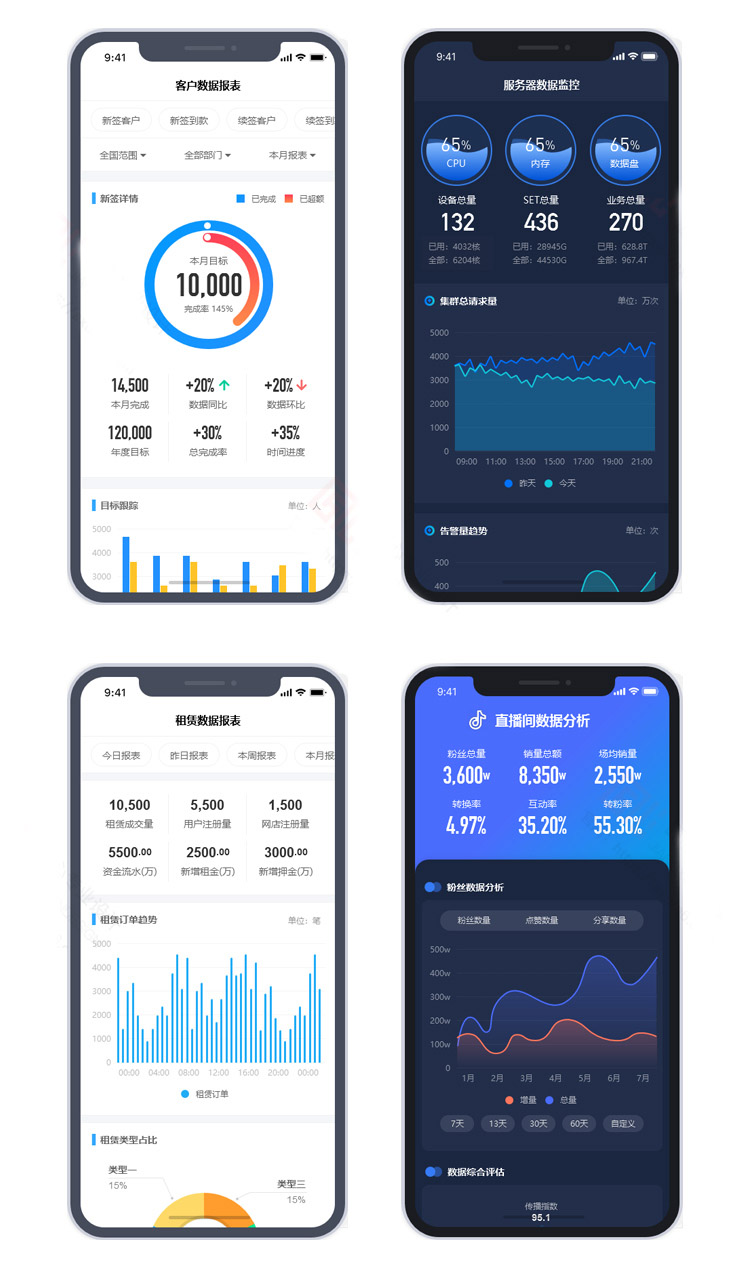
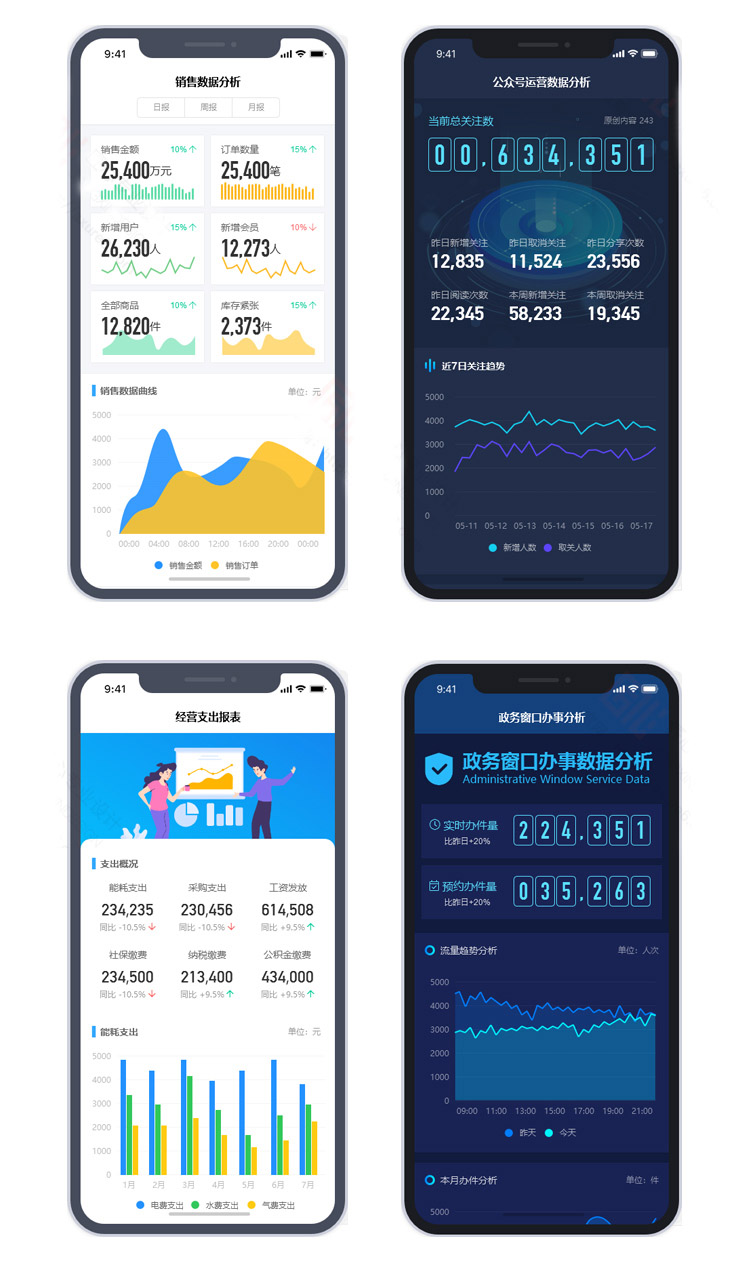
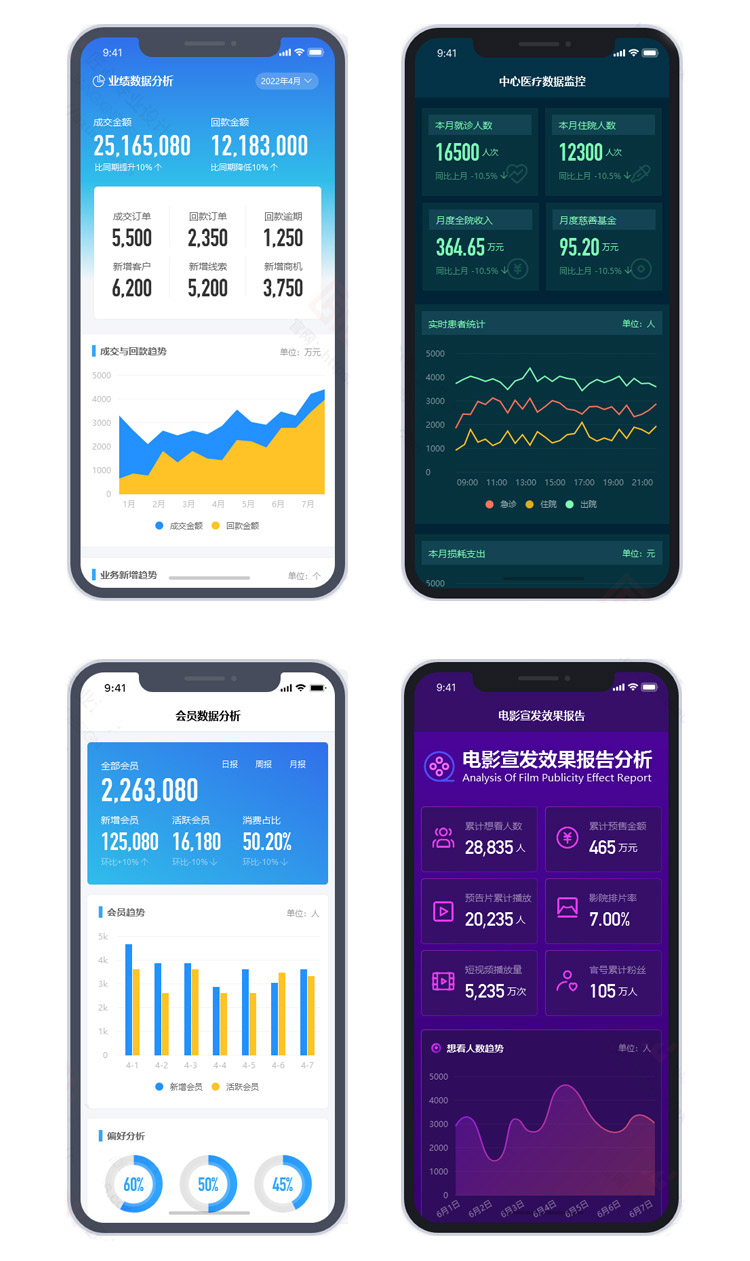
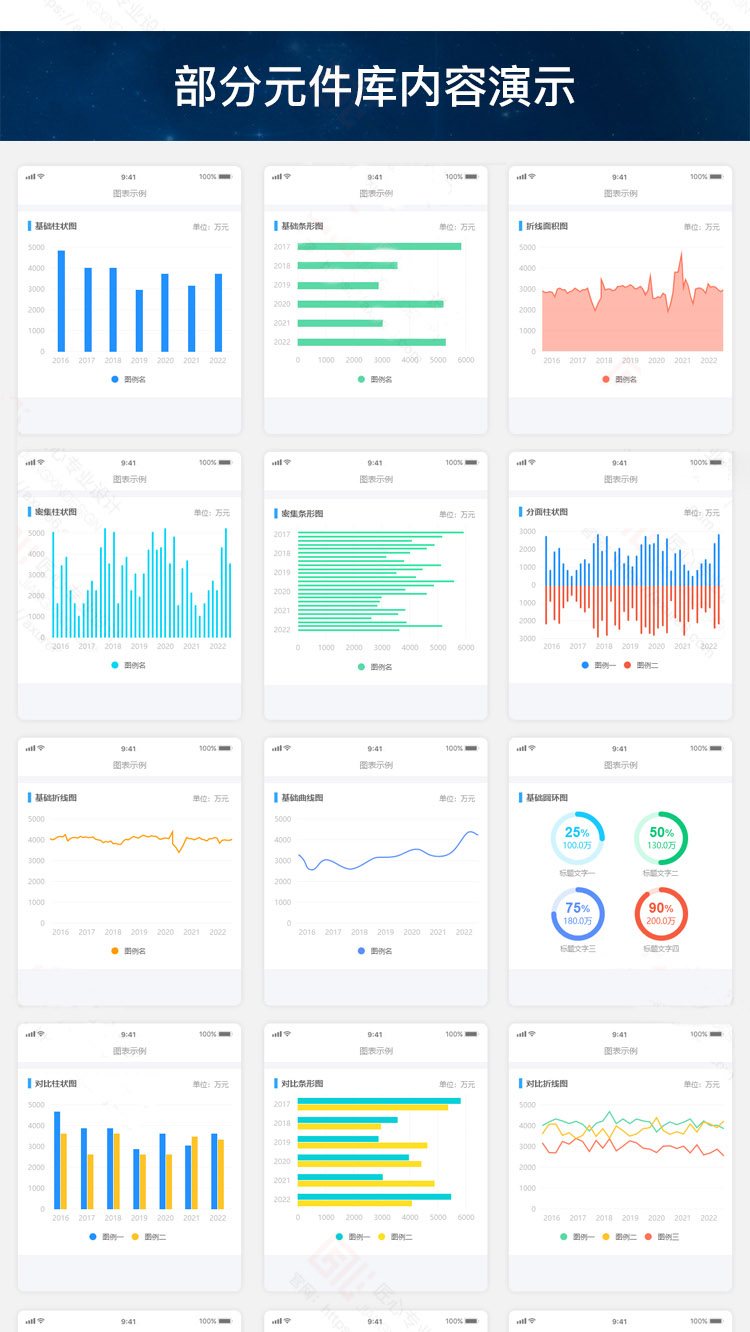
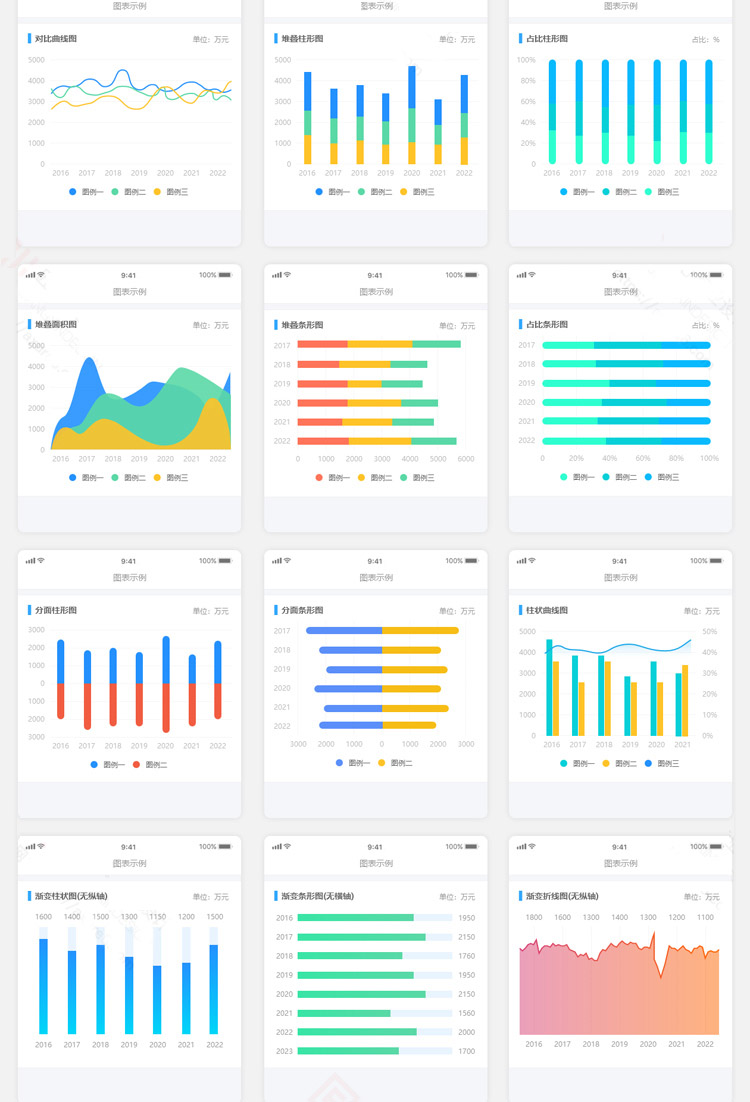
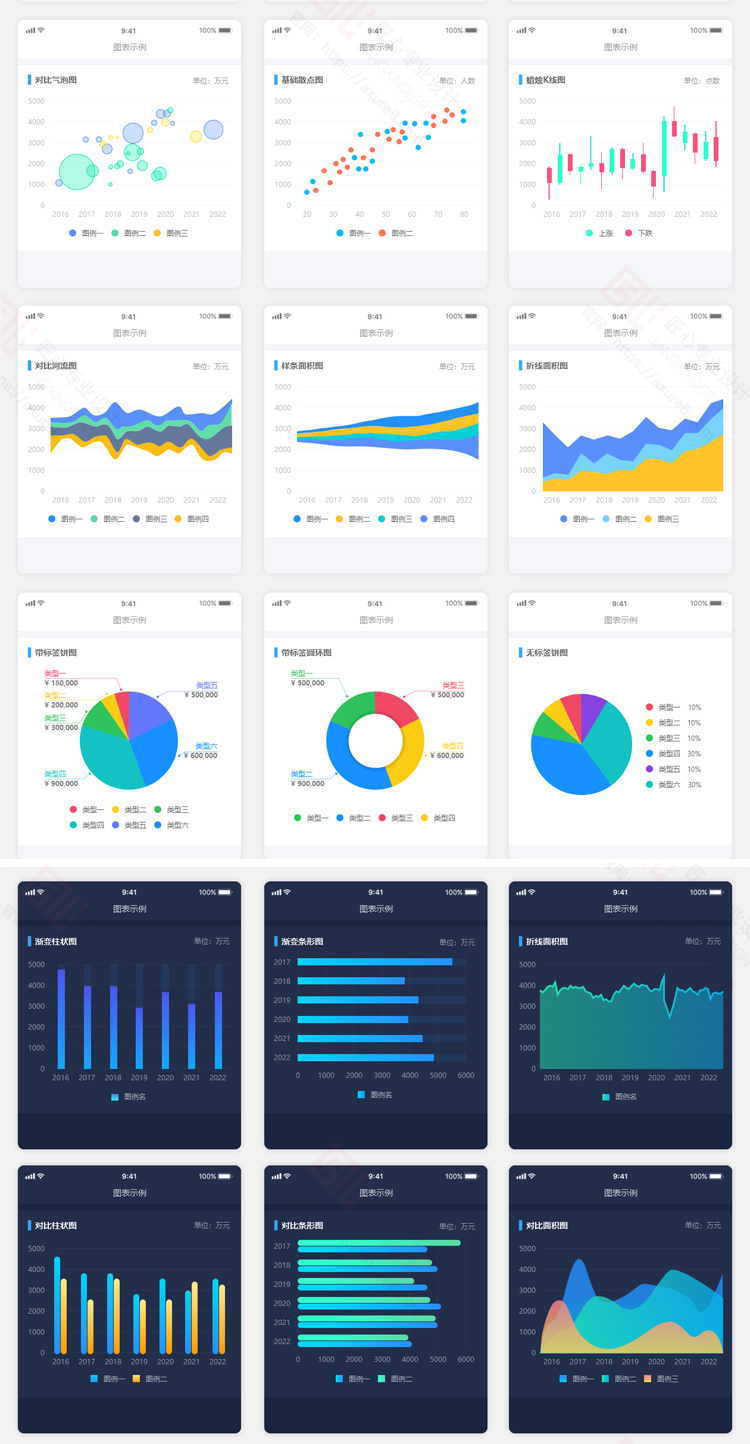
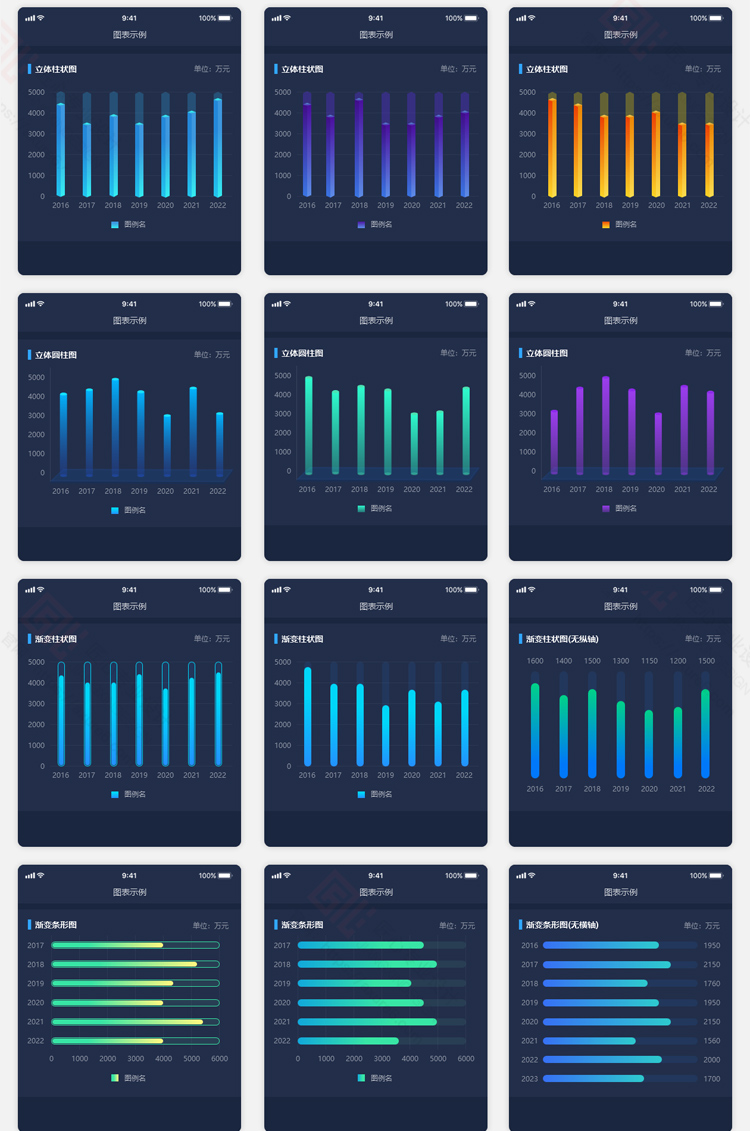
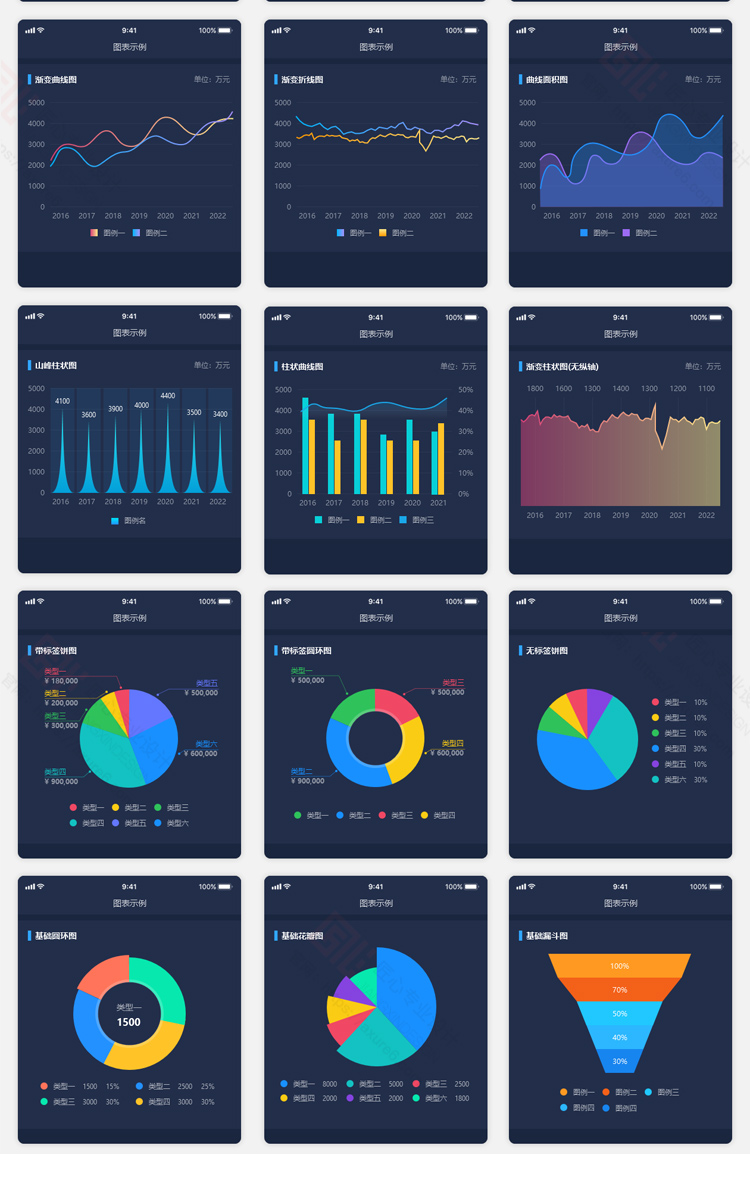
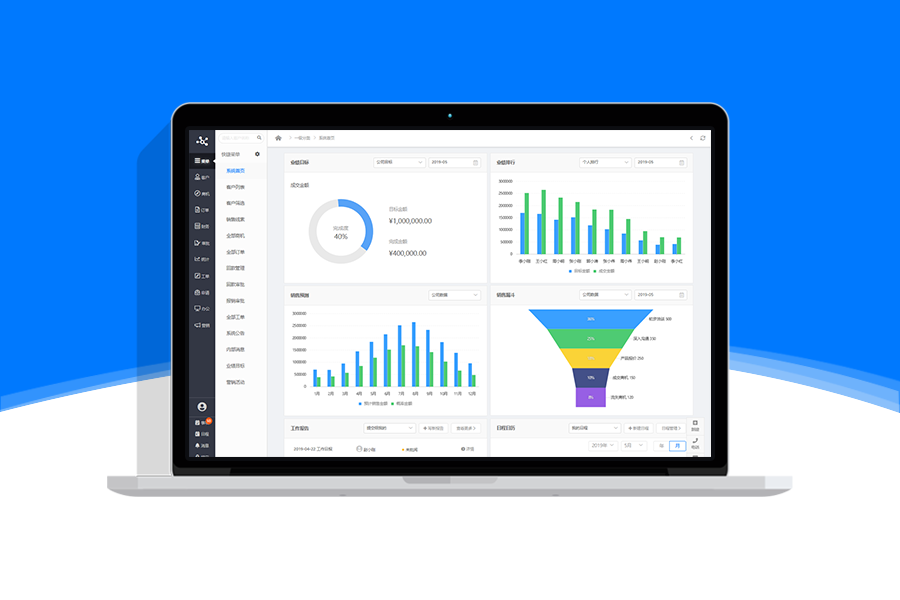
The Axure RP mobile data visualization component big data prototype template brings rich component content to the chart component in the form of templates, such as common charts, numerical displays, ranking displays, data cards, chart dynamic effects, map elements, and application components, which can meet the design requirements of most mobile terminal data visualization. It should be noted that although some chart components and material elements in the work reuse the relevant introductions in the large screen work, the mobile terminal not only reduces the display area, but also makes a lot of adjustments and improvements to the relevant knowledge to meet its characteristics. In addition, the unique charts and material content on mobile devices have also been enhanced in the chart component.
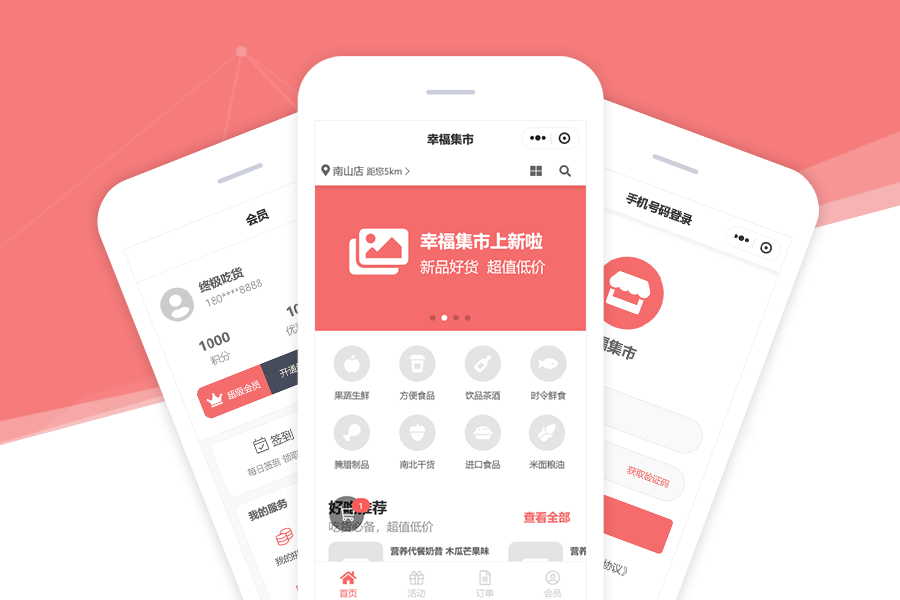
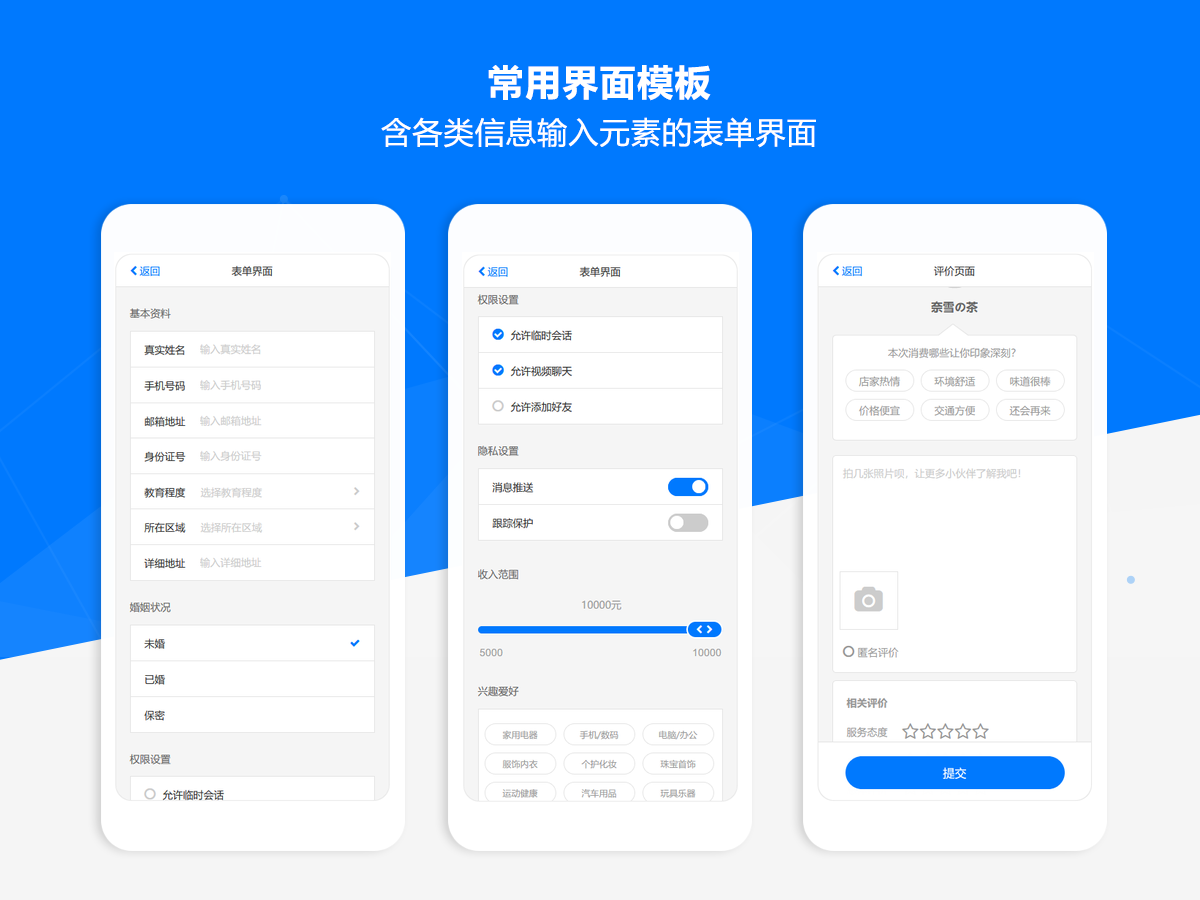
The page templates provided by the work include domain templates, login interfaces, time selection, original architecture, and other related materials. The template in this field has brought 40 cases of mobile terminal data visualization display, with various styles and demand scenarios. In addition, the work also provides a set of login interfaces with multiple styles, which can match the exported structured data visualization prototype scheme. In addition to rich visualization templates, the work also provides various original framework templates with different structures and styles, which can be combined with the rich charts and design components in the work to quickly expand the relevant mobile terminal visualization display content.
The provided 40 page template includes bright color style:
Bright Color Template: Customer Recharge Data Analysis, Platform Sales Data Analysis, Fire Rescue Brigade Trends (Dynamic Map), Company Business Expenditure Table, Community Resident Information Statistics, Company Salary Dashboard, New Customer Data Report, Machinery Rental Data Report, Enterprise Performance Data Analysis, Platform Member Data Analysis, E-commerce Business Data Analysis, Store Drainage Data Analysis, Store Operation Data Report, Store Customer Data Report, Consumer Customer Portrait Analysis, Beauty Store Data Report, Catering Store Data Analysis, Personal Consumption Data Analysis, Intelligent Breeding Data Visualization, Procurement, Sales, Inventory Data Analysis
Dark template: WeChat official account operation data analysis, company financial year-end report, movie promotion effect report, government window work analysis, center diagnosis and treatment data monitoring, live broadcast room data analysis, cluster server data monitoring, financial indicator data analysis, daily data of tourist attractions, visualization of business district ecology display (dynamic map), comprehensive management of urban areas (dynamic map), simulation display of business district ecology (dynamic map), visualization of power data overview (dynamic map), product pre-sale business data dashboard, intelligent city supervision investment decision-making, studio sales dashboard, real-time water detection and warning, real-time sales data of e-commerce platform, real-time data detection of parking cloud, national traffic monitoring and analysis.
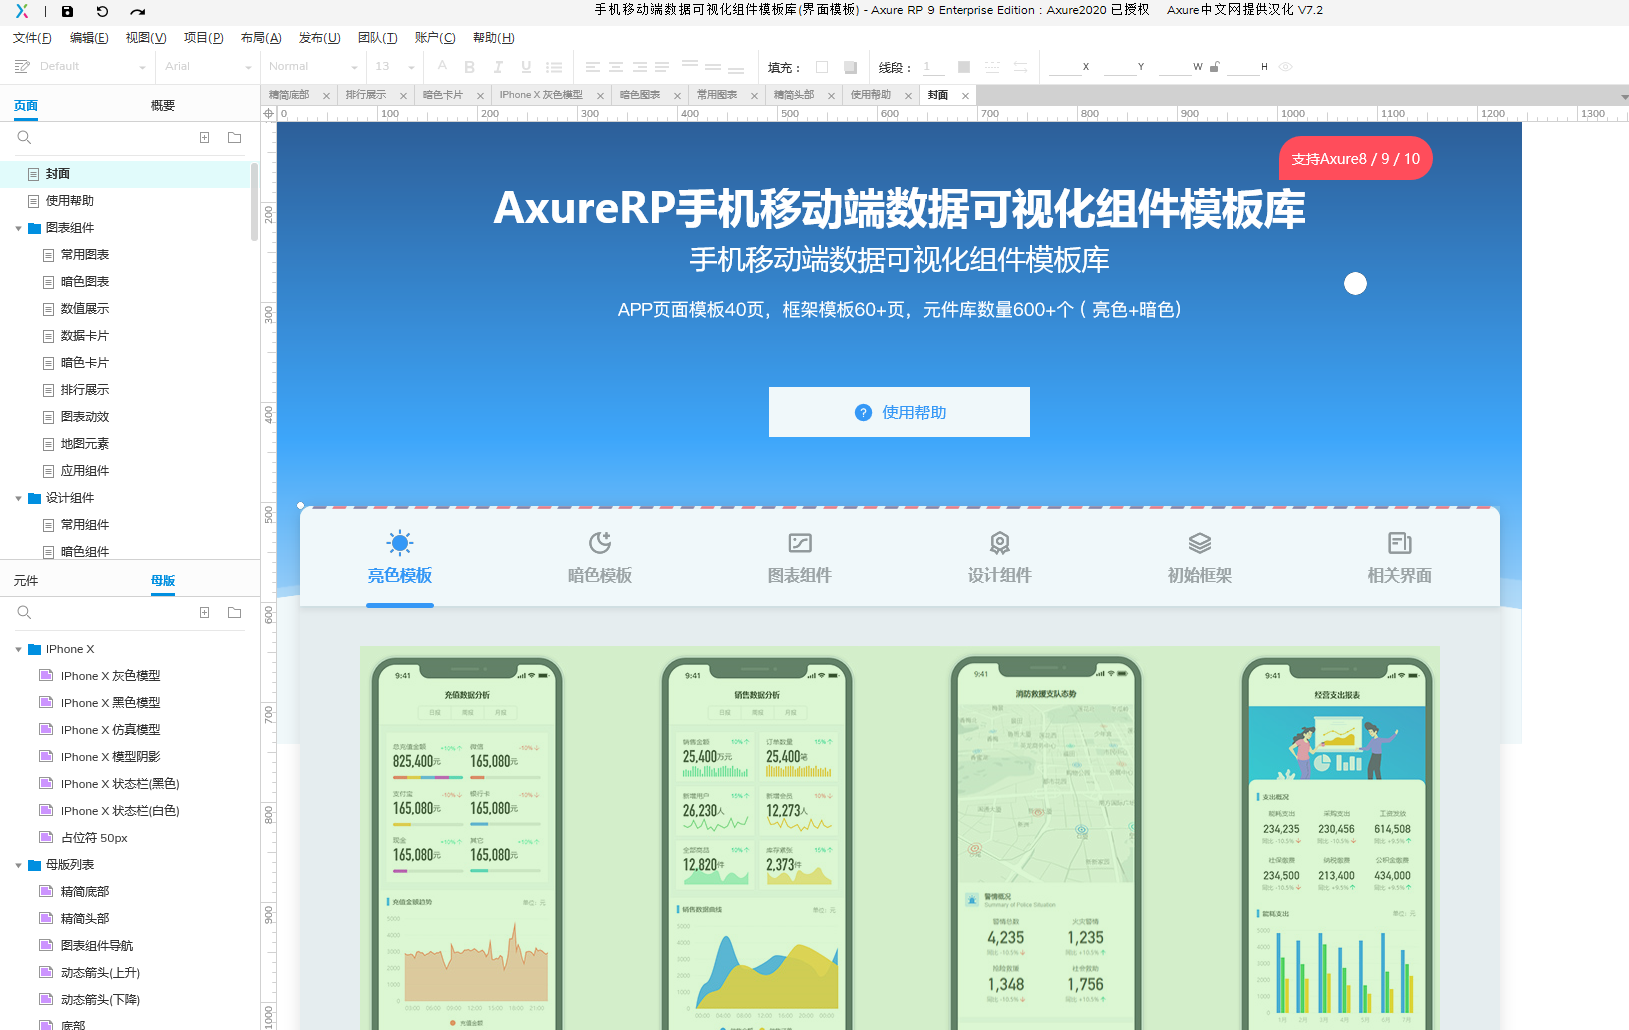
Screenshot
Copyright
Article Source: https://www.axuretheme.com/mobile/49.html

